SENSOR TECHNOLOGY
The operation of in-roadway and over-roadway sensors is described in this chapter. The technologies represented include inductive-loop detectors, magnetometers, video image processors, microwave radar sensors (presence detecting and Doppler), laser radar sensors, passive infrared sensors, ultrasonic sensors, passive acoustic sensors, and devices that utilize a combination of technologies. The information is intended to provide the practicing traffic engineer and electrical engineer with the knowledge needed to select the proper sensor technology for specific applications.
INDUCTIVE-LOOP DETECTORS
Since its introduction in the early 1960s, the inductive-loop detector has become the most utilized sensor in a traffic management system. The principal components of an inductive-loop detector system include:
- One or more turns of insulated loop wire wound in a shallow slot sawed in the pavement.
- Lead-in cable from the curbside pull box to the intersection controller cabinet.
- Electronics unit housed in a nearby controller cabinet.
Figure 2-1 displays a notional diagram of an inductive-loop detector system and the vehicle and steel reinforcement elements in the roadway with which it reacts.
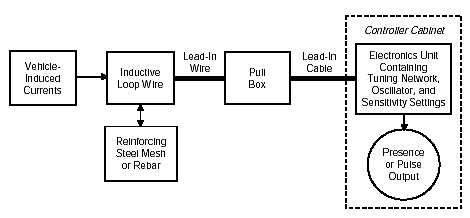
Figure 2-1. Inductive-loop detector system (notional).
The electronics unit transmits energy into the wire loops at frequencies between 10 kHz to 200 kHz, depending on the model. The inductive-loop system behaves as a tuned electrical circuit in which the loop wire and lead-in cable are the inductive elements. When a vehicle passes over the loop or is stopped within the loop, the vehicle induces eddy currents in the wire loops, which decrease their inductance. The decreased inductance actuates the electronics unit output relay or solid-state optically isolated output, which sends a pulse to the controller signifying the passage or presence of a vehicle.
|
Vehicles passing over or stopped within the detection area of an inductive-loop detector decrease the inductance of the loop. The electronics unit senses this event as a decrease in frequency and sends a pulse to the controller signifying the passage or presence of a vehicle. |
The following sections describe inductive-loop system theory, loop characteristics, and the electronics unit.
THEORY OF OPERATION
The principles of operation of the inductive-loop detector system discussed below are common to all of the inductive-loop system designs described in Chapter 4. The loop wire and lead-in cable contain a combination of resistance, inductance, and capacitance (both wire-to-wire and wire-to-Earth capacitance).
LOOP WIRE AND CABLE RESISTANCE
Inductive-loop wire, lead-in wires, and lead-in cables typically use #12, #14, or #16 American Wire Gauge (AWG) wire with the low frequency or direct current resistance measured in units of ohms (![]() ). The wire resistance is inversely proportional to the square of the wire diameter and increases as the wire diameter decreases. A volt-ohmmeter (VOM) measures direct current resistance. The wire resistance to alternating current flow increases as the frequency increases because the conducting area of the wire decreases due to the nonuniform flux inside the wire. The high frequency resistance cannot be measured with a VOM, but can be obtained from a measurement of quality factor as defined later in this chapter.
). The wire resistance is inversely proportional to the square of the wire diameter and increases as the wire diameter decreases. A volt-ohmmeter (VOM) measures direct current resistance. The wire resistance to alternating current flow increases as the frequency increases because the conducting area of the wire decreases due to the nonuniform flux inside the wire. The high frequency resistance cannot be measured with a VOM, but can be obtained from a measurement of quality factor as defined later in this chapter.
The loop in the roadway also contains an induced resistance (called the ground resistance) caused by transformer coupling between the loop and induced currents flowing in the roadway and subgrade materials. Appendix A provides a detailed derivation of ground resistance. Table 2-1 contains DC or low frequency resistance values for commercially available loop wire and lead-in cables.
| Manufacturer's wire or cable type | Function | Wire gauge (AWG) | DC resistance ( |
|---|---|---|---|
| 9438 | Loop wire | 14 | 0.0025 |
| 8718 | Lead-in cable | 12 | 0.0019 |
| 8720 | Lead-in cable | 14 | 0.0029 |
| 8719 | Lead-in cable | 16 | 0.0045 |
LOOP INDUCTANCE
All wire conductors carrying an electrical current produce magnetic flux lines, which encircle the current flow that forms them. The magnetic flux induces the electrical property called inductance, measured in henrys (H). The inductance of the wire is called self-inductance. If the flux from current flowing in one wire couples to other wires, the resulting inductance is called mutual inductance.
Figure 2-2 displays the flux around a single turn wire loop. The plane containing the flux is normal to the current flow in the wire, where the flux direction is determined by the right hand rule. This rule is applied as follows: Place the right hand under the wire with fingers curled in the direction of the flux lines. The thumb points in the direction of the current flow. All flux lines are in the same direction inside the loop.
Figure 2-3 illustrates the magnetic flux lines for a solenoid or coil whose length is greater than the diameter. The magnetic flux is uniform inside the coil except near the ends. The magnetic field for this coil geometry is given by
 (2-1)
(2-1)
where
H = Magnetic field, ampere turns per meter, not to be confused with the units of inductance in henrys
N = Number of turns
I = Coil current, amperes
l = Length of coil, meters.
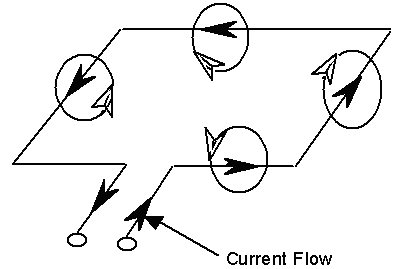
Figure 2-2. Magnetic flux around loop. The black arrows represent the current flow in the wire and the white arrows the induced flux as determined by the right hand rule.
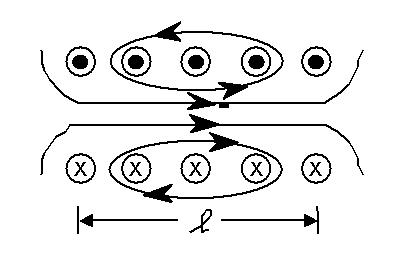
Figure 2-3. Magnetic flux for solenoid (coil). The black arrows represent the current flow, while the circles with the black and "X" centers represent the induced flux flow out of and into the plane of the figure, respectively.
Since the magnetic flux is uniform inside the coil, the flux is given by
![]() (2-1)
(2-1)
where![]() = Magnetic flux, webers
= Magnetic flux, webers
B = Magnetic flux density, webers per m2
A = Cross sectional area of coil, m2.
The magnetic flux density is expressed as ![]() (2-3)
(2-3)
where
![]() r = Relative permeability of material (1 for air)
r = Relative permeability of material (1 for air)![]() 0 = 4
0 = 4![]() x 10-7 henrys per meter.
x 10-7 henrys per meter.
The inductance of a coil is defined as (2-4)
(2-4)
where
L = Inductance, henrys
N = Number of turns
I = Coil current, amperes.
The inductance of a coil, with a length much greater than the coil area to ensure uniform magnetic flux inside the coil, is given by (2-5)
(2-5)
|
A roadway inductive loop has a nonuniform flux field that produces an inductance value given by Equation 2-6. |
This equation shows that coil inductance is directly proportional to the turns squared and the coil area, and inversely proportional to coil length. Although the inductance formula as written is not directly applicable to a roadway inductive loop, the formula can be modified by a factor F' to account for the nonuniform flux in the roadway inductive loop. Thus
 (2-6)
(2-6)
Equation 2-6 is applied to a loop inductance calculation in Appendix B. In this case, l is referred to as the "length of the current sheet." Equation 2-6 shows that iron, with a relative permeability greater than one, will increase the loop inductance. Although the greatest increase in inductance occurs when an iron core passes directly through the loop, the iron mass of a vehicle engine, transmission, or differential will slightly increase the loop inductance. This condition is called the "ferromagnetic effect."
FERROMAGNETIC EFFECT AND VEHICLE DETECTION
However, the ferromagnetic effect produced by the iron mass of the engine, transmission, or differential does not create a presence or passage indication by the controller. When the heavy ferrous engine enters the inductive loop's detection area, it increases the inductance of the wire loop. This effect occurs because the insertion of any iron core into the field of any inductor reduces the reluctance (i.e., a term that corresponds to the resistance of a magnetic circuit) of the flux path and, therefore, increases the net inductance. However, the peripheral metal of the vehicle has an opposite effect on the inductance due to eddy currents that are produced. The decrease in inductance from the eddy currents more than offsets the increase from the ferrous mass of the engine, and the net effect is an overall reduction in the inductance of the wire loop.
|
The ferromagnetic effect increases loop inductance. However, vehicle-induced eddy currents decrease loop inductance even more. Therefore, net effect is decreased loop inductance when a vehicle passes through the detection zone of an inductive loop. |
LOOP CHARACTERISTICS
The inductive-loop detector provides a wide range of geometries to the traffic engineer for satisfying diverse traffic signal control applications, as discussed in Chapter 4. The size and the number of turns of a loop or combination of loops, together with the length of the lead-in cable, must produce an inductance value that is compatible with the tuning range of the electronics unit and with other requirements established by the traffic engineer. NEMA standards for inductive-loop detectors (see Appendix J) specify that an electronics unit must be capable of operating satisfactorily over an inductance range of 50 to 700 microhenrys (µH). Some units tolerate much larger inductance values, for example, from several loops wired in series. While larger inductance values are technically feasible, NEMA has specified a conservative upper limit to promote practices compatible with all existing electronics units.
LOOP CAPACITANCE
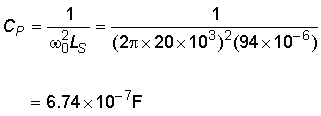
Figure 2-4 depicts the dominant capacitive coupling phenomena that exist between (1) loop wires themselves and (2) loop wires and the sidewalls of the sawcut slot. The capacitance related to the sawcut slot is directly proportional to the dielectric constant of the slot sealing material. Figure 2-5 is an equivalent electrical circuit representing the inductive-loop wire resistance Rs, inductance Ls, and capacitance Cp that are created when a loop is installed in roadway pavement.
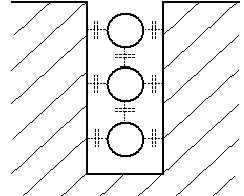
Figure 2-4. Capacitive coupling between the loop wires themselves and the sawcut slot sidewalls.
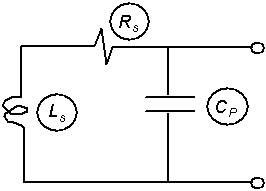
Figure 2-5. Equivalent electrical circuit for an inductive loop with capacitive coupling to the sidewalls of a sawcut slot.
The measurement data in Figure 2-6 show the effect capacitance Cp has on increasing the inductance at the loop terminals as operating frequency increases.(1) If the slot sealing material is hygroscopic (i.e., readily absorbs and retains water) or incomplete (i.e., does not fill the slot or encapsulate the wires, allowing water to enter the slot and penetrate between the loop wire turns), the variation in capacitance, and hence inductance, will be large because of the large dielectric constant of water.
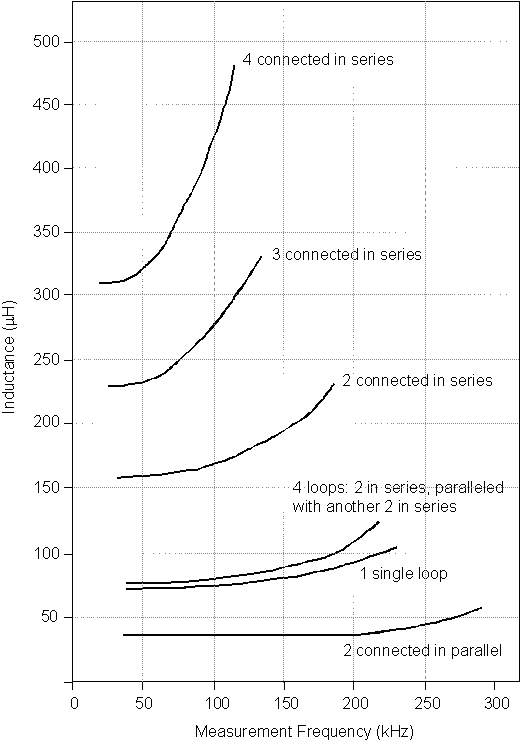
Figure 2-6. Average values of loop inductance vs. measuring frequency for series, parallel, and series-parallel connections of 6- x 6-ft (1.8- x 1.8-m) inductive loops. The plots represent curve fits to the measured data.
|
Loop system capacitance must be minimized for proper operation at frequencies of 10 kilohertz (kHz) and greater. |
The capacitance change due to water can, therefore, result in unstable inductive-loop detector operation. At frequencies of 1 kilohertz (kHz), the capacitance effect is insignificant. At frequencies of 10 kHz or greater, the capacitance effect is important. When loop inductance is measured at 20 kHz or greater, the measurement frequency must be specified since the measured inductance is frequency dependent. A large number of turns on large area loops further increases the loop capacitance and lowers the self-resonant frequency of the loop (i.e., no loop inductance is measured at the loop terminals when the loop is self resonant).
Figure 2-6 also illustrates how different series, parallel, and series-parallel configurations of wire loops affect the resultant loop inductance and its rate of change with frequency. The effect of the connection method on system inductance is discussed further under "Loop System Inductance Calculations," later in this chapter.
LOOP QUALITY FACTOR Q
The resonant efficiency of a circuit is expressed through the dimensionless quality factor Q. If the losses of the inductor are large, Q is low. A perfect inductor has no losses; therefore, there is no dissipation of energy within the inductor and Q is infinite.
|
Loop quality factor Q is a measure of the losses in an inductive-loop detector system. |
Total energy loss in a lossy inductor is calculated by modeling the inductor as an equivalent lossless inductor in series with a resistor. The quality factor is equal to the ratio of the inductive reactance to the resistive loss of the inductor. Since inductive reactance is a frequency-dependent quantity, the frequency must be specified when measuring quality factor. The formula for Q is written as (2-7)
(2-7)
where
Q = Quality factor
![]() = 3.14159 (a constant)
= 3.14159 (a constant)
f = Inductive-loop system excitation frequency, Hz
LS = Loop series inductance, henrys
RS = Loop series resistance, ohms![]() = Radian frequency = 2
= Radian frequency = 2![]() f.
f.
The resonant frequency ![]() 0 of an inductive-loop-equivalent electrical circuit represented by Figure 2-5 is given by
0 of an inductive-loop-equivalent electrical circuit represented by Figure 2-5 is given by
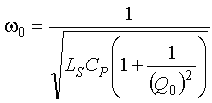 (2-8)
(2-8)
From Equation 2-7, (2-9)
(2-9)
Therefore, the equation for the loop quality factor Q0 of the resonant circuit becomes (2-10)
The electronics unit adds a load resistance RL in parallel with the capacitor CP shown in the inductive-loop-equivalent electrical circuit of Figure 2-5. The effect of RL is to reduce the quality factor. The resulting quality factor is![]() (2-11)
(2-11)
or![]() (2-12)
(2-12)
where R'P is the transformed series resistance in parallel with RL.
The loaded quality factor QL of the circuit in Figure 2-5 with a load resistance RL in parallel with the capacitor CP is (2-13)
Quality factors of 5 and above are recommended when installing inductive-loop detectors as oscillators in most electronics units will not operate with low Q. Moisture in the pavement and subgrade can increase the loop ground resistance such that the Q of the inductive-loop system decreases below 5, thereby reducing the sensitivity of most inductive-loop electronics units. Loop capacitance will also reduce Q.
The loaded quality factor QL given by Equation 2-13 applies to low loss applications, where the quality factor is large and f, LS, and RS can be readily measured. Inductive-loop detectors used in roadways, on the other hand, are not as adaptable to the above analysis because the inductance is distributed over the loop and lead-in cable and is difficult to measure. Calculation of the quality factor for roadway loops is further complicated by the larger actual resistances of the loop wire and lead-in cable as compared to the series value measured with an Ohm-meter. The extra losses are due to the high frequency excitation and ground currents in the pavement associated with the loop configuration and the roadway environment near the wire. As a result, the Q of an identical wire configuration will vary from location to location.
|
Losses caused by the high frequency loop excitation and ground currents in the pavement near the wire further reduce the quality factor. As a result, the Q of an identical wire configuration will vary from location to location. |
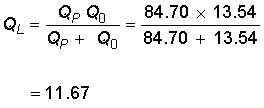
Figure 2-7 illustrates an inductive-loop system quality factor calculation using Q0 and QP. Tables 2-2 through 2-4 list calculated quality factors for rectangular, quadrupole, and circular inductive loops, respectively, of 1, 2, 3, 4, and 5 turns. Loops are excited at 20 kHz in these tables, with conductor and/or quadrupole lateral spacing of 200 mils. All inductance and quality factors are apparent values (i.e., loop capacitance and resistance are included).
|
LOOP SYSTEM QUALITY FACTOR Q CALCULATION Assumptions: Quality Factor of Inductive-Loop System: Assume that the inductive-loop electronics unit adds a shunt parallel resistance of 1,000 ohms. Then Therefore, the total loaded loop system quality factor is |
Figure 2-7. Loop system quality factor sample calculation.
Table 2-2. Rectangular loop inductance and quality factor parameters at f = 20 kHz.*
| Wire gauge (AWG) | 1 Turn inductance ( | 1 Turn quality factor Q | 2 Turn induc-tance ( | 2 Turn quality factor Q | 3 Turn inductance ( | 3 Turn quality factor Q | 4 turn inductance ( | 4 Turn quality factor Q | 5 Turn inductance ( | 5 Turn quality factor Q |
|---|---|---|---|---|---|---|---|---|---|---|
| 12 | 10 | 20 | 35 | 30 | 73 | 37 | 123 | 43 | 184 | 47 |
| 14 | 11 | 16 | 36 | 24 | 74 | 30 | 125 | 35 | 186 | 40 |
| 14** | 63 | 12 | 89 | 14 | 128 | 18 | 180 | 21 | 243 | 25 |
| 16 | 11 | 12 | 37 | 18 | 75 | 23 | 126 | 28 | 188 | 31 |
| 18 | 11 | 8 | 37 | 13 | 77 | 17 | 127 | 20 | 189 | 23 |
*6 x 6 ft (1.8 x 1.8 m) loop. ** With lead-in cable.
| Wire gauge (AWG) | 1 Turn inductance ( | 1 Turn quality factor Q | 2 Turn induc-tance ( | 2 Turn quality factor Q | 3 Turn inductance ( | 3 Turn quality factor Q | 4 turn inductance ( | 4 Turn quality factor Q | 5 Turn inductance ( | 5 Turn quality factor Q |
|---|---|---|---|---|---|---|---|---|---|---|
| 12 | 17 | 22 | 60 | 33 | 125 | 40 | 211 | 46 | 315 | 50 |
| 14 | 18 | 17 | 61 | 27 | 127 | 33 | 213 | 38 | 317 | 43 |
| 16 | 18 | 13 | 62 | 20 | 129 | 26 | 215 | 30 | 320 | 34 |
| 18 | 19 | 9 | 63 | 14 | 130 | 19 | 217 | 22 | 323 | 25 |
| Wire gauge (AWG) | 1 Turn inductance ( | 1 Turn quality factor Q | 2 Turn induc-tance ( | 2 Turn quality factor Q | 3 Turn inductance ( | 3 Turn quality factor Q | 4 turn inductance ( | 4 Turn quality factor Q | 5 Turn inductance ( | 5 Turn quality factor Q |
|---|---|---|---|---|---|---|---|---|---|---|
| 12 | 10 | 20 | 34 | 31 | 71 | 38 | 120 | 44 | 179 | 49 |
| 14 | 10 | 16 | 35 | 25 | 72 | 32 | 121 | 37 | 181 | 41 |
| 16 | 10 | 12 | 35 | 19 | 73 | 24 | 122 | 29 | 182 | 32 |
| 18 | 11 | 8 | 36 | 13 | 74 | 17 | 123 | 21 | 184 | 24 |
LOOP LEAD-IN WIRE
Table 2-5 contains loop-to-pull box lead-in wire inductance, capacitance, and resistance values for two common types of wire. The two lead-in wires from the start and end of the loop turns should be twisted together to form a symmetrically twisted pair from the loop to the pull box. The twisting reduces crosstalk and noise pickup in the lead-in wire. Most manufacturers recommend at least five turns per foot (16.5 turns per meter). The wire twists form small loops along the wire, which alternate in winding direction. An external magnetic field from noise or crosstalk induces voltages in the small loops, which almost cancel, thus reducing interference. The importance of twists in the lead-in wire is discussed further in Chapter 5.
| Wire manufacturer and type | Wire insulation type | AWG number | Jacket diameter (mils) | Number of twists per foot | Inductance ( | Capacitance (pF/ft) | Resistance ( |
|---|---|---|---|---|---|---|---|
| XHHW | Cross-linked polymer | 14 stranded | 130 | 3 to 4 | 0.24 | 10 | 0.006 |
| Belden 9438 | High density polyethylene | 14 stranded | 139 | 5.5 | 0.22 | 10 | 0.00252 |
LEAD-IN CABLE
Shielded, twisted wire pairs are used for the lead-in cable (home run cable), which runs from the pull box to the electronics unit terminals in the controller cabinet. The conducting shield reduces interference from external electric fields. Lead-in cable inductance, capacitance, and resistance values for several types of cable are given in Table 2-6.
| Cable manufacturer and type | Wire insulation type | AWG number | Insulation diameter (mils) | Cable insulation type | Inductance ( | Capacitance (pF/ft) | Resistance ( |
|
|---|---|---|---|---|---|---|---|---|
| Belden | 8718 | Polyethylene | 12 | 37 | Vinyl | 0.2 | 25 | 0.0019 |
| 8720 | Polyethylene | 14 | 32 | Vinyl | 0.2 | 24 | 0.0029 | |
| 8719 | Polyethylene | 16 | 32 | Vinyl | 0.2 | 23 | 0.0045 | |
| Clifford | IMSA | Polyethylene | 12 | 30 | Polyethylene | 0.2 | 25 | 0.0016 |
| Specification | Polyethylene | 14 | 30 | Polyethylene | 0.2 | 24 | 0.0025 | |
| 50-2-1984 | Polyethylene | 16 | 30 | Polyethylene | 0.2 | 23 | 0.0040 | |
The measurements of loop system quality factor (with 100 ft (30 m) of shielded lead-in cable connected to a loop) in Appendix D show that little benefit is gained from using larger conductor diameters in the shielded lead-in cable. For example, the quality factor associated with #14 AWG shielded lead-in cable is not substantially reduced by substituting #12 cable. The principal loss results from the type of shielding rather than the conductor diameter. Table 2-7 illustrates how lead-in cable type and length affect the quality factor.
CALCULATING INDUCTANCE
Several simplified formulas are available for calculating the approximate inductance of an inductive-loop detector. More accurate inductance values are obtained from the mutual coupling method discussed in Appendix A.
The simplified formulas provide acceptable accuracy for the self inductance of multiturn, rectangular, quadrupole, and circular loops, which have a large area relative to the conductor spacing. The approximations compare favorably with a range of measured inductive-loop inductance values.
Appendix C contains calculated loop inductance values for various size loops and shapes (rectangular, quadrupole, and circular). Inductance and quality factor for several numbers of turns of wire were calculated using the mutual coupling formula discussed later in this chapter.
| Turns of #14 AWG wire in loop | Lead-in cable type, Belden | Lead-in cable length (ft) | Cable wire gauge (AWG) | Total parallel capac. ( | Series loop induct. ( | Lead-in cable induct† ( | Total series induct. ( | Loop resist.* ( | Lead-in cable resist.†,** ( | Total series resist. ( | Loop system Q | Loop system loaded Q (k |
|---|---|---|---|---|---|---|---|---|---|---|---|---|
| 3 | 8718 | 100 | 12 | 0.674 | 74 | 20 | 94 | 0.25 | 0.62 | 0.87 | 14 | 12 |
| 3 | 8720 | 100 | 14 | 0.670 | 74 | 21 | 95 | 0.25 | 0.80 | 1.05 | 11 | 10 |
| 3 | 8719 | 100 | 16 | 0.670 | 74 | 21 | 95 | 0.25 | 1.00 | 1.25 | 10 | 9 |
| 4 | 8718 | 100 | 12 | 0.437 | 125 | 20 | 145 | 0.33 | 0.62 | 0.95 | 19 | 14 |
| 4 | 8720 | 100 | 14 | 0.434 | 125 | 21 | 146 | 0.33 | 0.80 | 1.13 | 16 | 13 |
| 4 | 8719 | 100 | 16 | 0.434 | 125 | 21 | 146 | 0.33 | 1.00 | 1.33 | 14 | 11 |
| 5 | 8718 | 100 | 12 | 0.312 | 186 | 20 | 206 | 0.42 | 0.62 | 1.04 | 25 | 15 |
| 5 | 8720 | 100 | 14 | 0.306 | 186 | 21 | 207 | 0.42 | 0.80 | 1.22 | 21 | 14 |
| 5 | 8719 | 100 | 16 | 0.306 | 186 | 21 | 207 | 0.42 | 1.00 | 1.42 | 18 | 12 |
| 5 | 8718 | 1,000 | 12 | 0.172 | 186 | 200 | 386 | 0.42 | 6.20 | 6.62 | 7 | 5 |
| 5 | 8720 | 1,000 | 14 | 0.160 | 186 | 210 | 396 | 0.42 | 8.00 | 8.42 | 6 | 5 |
| 5 | 8719 | 1,000 | 16 | 0.160 | 186 | 210 | 396 | 0.42 | 10.00 | 10.42 | 5 | 4 |
Loop size is 6 x 6 ft (1.8 x 1.8 m). Excitation frequency is 20 kHz.
* Measured series resistance of loop 3 ft (0.9 m) above the laboratory floor.
** 8719 resistance value estimated.
† Lead-in cable length is 100 ft.
LOOP SYSTEM INDUCTANCE CALCULATIONS
Inductance attributed to the lead-in cable is added to wire loop inductance at the rate of 21 ![]() H per 100 ft (30 m) of #14 AWG lead-in cable. For example, a 6- x 6-ft (1.8- x 1.8-m) rectangular loop should have three turns, according to Appendix C, and an inductance of 74
H per 100 ft (30 m) of #14 AWG lead-in cable. For example, a 6- x 6-ft (1.8- x 1.8-m) rectangular loop should have three turns, according to Appendix C, and an inductance of 74 ![]() H. If the lead-in cable is 200 feet (61 m) in length, the total inductance is
H. If the lead-in cable is 200 feet (61 m) in length, the total inductance is
 (2-14)
The inductance L of two or more loops connected in series is additive such that L = L1 + L2 ±2M, where L1 and L2 represent the inductance of each of the individual series-connected loops, M is the mutual inductance between the two loops, and the sign of M is positive if flux is increased by current flowing in the same direction in the closest spaced loop wires.
The mutual inductance is negligible when the loops are separated by a large distance. In this case, L = L1 + L2, i.e., the loops are connected in series producing maximum loop inductance.
If the loops are connected in parallel, then the combined inductance is calculated as 1/L = 1/L1+1/L2. For example, the combined inductance of two 6- x 6-ft (1.8- x 1.8-m) loops of three turns each connected in parallel is given by![]() (2-15)
(2-15)
Thus, 2L = 74 ![]() H and L = 37
H and L = 37 ![]() H.
H.
Thus, parallel connection of loops reduces the inductance. Good design practice requires that the combined loop inductance be greater than the lower limit of 50 ![]() H. Therefore, the parallel connection described above is not suitable as a vehicle sensor.
H. Therefore, the parallel connection described above is not suitable as a vehicle sensor.
In some cases, both series and parallel connections of inductive loops are desirable. Consider, for example, four 6- x 6-ft (1.8- x 1.8-m) three-turn loops installed 9 ft (2.7 m) apart to provide detection in a left-turn lane. Three possible types of connections are shown in Figure 2-8. Connection in series produces an inductance of 4 x 74 = 296 ![]() H. Parallel connection produces only 18.5
H. Parallel connection produces only 18.5 ![]() H (4L = 74
H (4L = 74 ![]() H, L = 18.5 µH). A series-parallel configuration, where the upper two loops are connected in series and the bottom two loops are connected in series, produces two loop pairs, which are then connected in parallel to give a combined inductance of 74
H, L = 18.5 µH). A series-parallel configuration, where the upper two loops are connected in series and the bottom two loops are connected in series, produces two loop pairs, which are then connected in parallel to give a combined inductance of 74 ![]() H.
H.
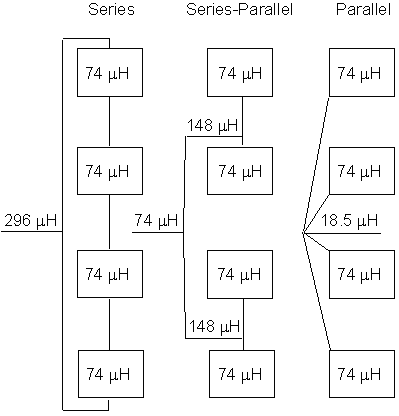
Figure 2-8. Four 6- x 6-ft (1.8- x 1.8-m) three-turn loops connected in series, parallel, and series-parallel.
NUMBER OF TURNS REQUIRED
Wire loops should have a sufficient number of turns to provide a nominal minimum inductance of 100 ![]() H per loop to ensure stable operation of the inductive-loop system. A rule of thumb for the number of turns needed to produce an inductance value within the required range is:
H per loop to ensure stable operation of the inductive-loop system. A rule of thumb for the number of turns needed to produce an inductance value within the required range is:
- If the loop perimeter is less than 30 ft (9 m), use three turns of wire.
- If the loop perimeter is over 30 ft (9 m), use two turns of wire.
LOOP SENSITIVITY TO AN ELECTRICALLY CONDUCTIVE OBJECT
The current flowing through the loop wire creates a magnetic field around the wire as given by Equations 2-1, 2.1 and 2-3. If a vehicle (or any other electrically conductive object) enters this magnetic field and the magnetic field or a component of the magnetic field is normal to the area of the object, eddy currents are induced in the conducting object. The eddy currents generate another magnetic field that opposes the magnetic field of the loop, causing a decrease in the total magnetic field around the loop. Since the loop inductance is proportional to magnetic flux, the loop inductance decreases.
|
Eddy currents are induced in an electrically conductive object, such as a metal vehicle, by the magnetic field created by the current flowing through the wire loop. The eddy currents then generate a magnetic field that opposes the original magnetic field produced by the inductive loop. The result is a decrease in loop inductance. |
Loop sensitivity to a conductive object can be tested with a 12 inches (30 cm) long wire formed into a circle whose diameter is approximately 4 inches (10 cm). The circular loop forms an open electrical circuit when the wire ends are held such that they do not touch one another. No actuation should occur when the open circular loop is rapidly moved horizontally over the in-roadway inductive loop. When the ends of the circular loop are made to touch, forming a closed circuit before being thrust over the in-roadway loop, an actuation will occur because of the flow of eddy currents. This demonstrates that it is the shorted turn, and not the wire or vehicle mass, which is important in producing the actuation.
BICYCLE AND MOTORIZED VEHICLE DETECTION MODELS
Figure 2-9 illustrates the detection of a bicycle or motorcycle by an inductive loop. These conveyances can be modeled as a vertical conducting object relative to the plane of the loop. When the cycle travels along the loop wire, eddy currents are induced in the conducting wheel rims and frame. When the cycle is directly over the loop wire, coupling between the inductive loop and the cycle is maximized.
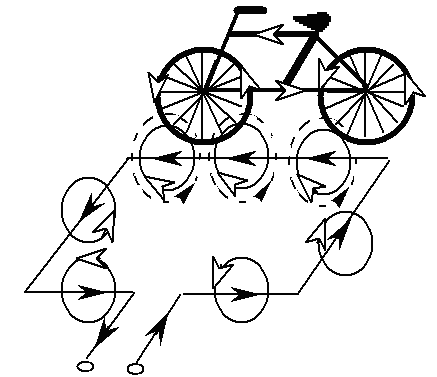
Figure 2-9. Bicycle detection showing induced eddy currents. The black arrows represent the current flow in the loop wire and the white arrows the induced flux.
A vehicle undercarriage, on the other hand, is a horizontal target. As shown in Figure 2-10, the undercarriage is modeled as a conducting rectangular plate, whose width is equal to the width of the vehicle and whose length is equal to the length of the vehicle at some average undercarriage height.
A conducting mesh can be used to approximate the electrical characteristics of the continuous plate. When the mesh is symmetrically located over the inductive loop to produce maximum sensitivity, all induced internal mesh currents cancel. This results in a single induced current flowing around the perimeter of the mesh, which is equivalent to a single turn rectangular wire loop or shorted turn. The air core transformer on the right of Figure 2-10 models the coupling between the vehicle undercarriage, as represented by a shorted turn of wire, and the inductive-loop wire.
Maximum vehicle detection sensitivity is produced by a shorted turn at minimum distance from the loop wires. Consequently, the ideal inductive-loop detector has a shape that approximates the vehicle's periphery. That is, a 6- x 6-ft (1.8- x 1.8-m) square loop would be preferable to one the size of a vehicle's engine.
Because of undercarriage height, high-bed trucks are difficult to detect. Detection of these vehicles is maximized when the width of the loop is equal to the width of the truck, lane width permitting. The length of the loop should not be less than its width to avoid a loss in sensitivity.

Figure 2-10. Vehicle undercarriage model. The upper part of the figure depicts the vehicle undercarriage electrical models and the lower part the inductive-loop wire.
MUTUAL INDUCTANCE
Inductive-loop self-inductance is defined using the loop's magnetic flux. When the magnetic flux of a loop couples to a vehicle, the coupled flux is used to define mutual inductance.
Figure 2-10 showed the magnetic coupling between a loop and shorted turn, which behaves as an air core transformer. The mutual inductance between the primary circuit (i.e., the inductive loop) and secondary circuit (i.e., the shorted turn) is given by
 (2-16)
where
M21 = Mutual inductance between circuit one (loop) and circuit two (shorted turn), henrys
N2 = Number of turns (equals 1 for a shorted turn)
![]() 21 = Magnetic flux normal to shorted turn area, webers
21 = Magnetic flux normal to shorted turn area, webers
I1 = Current flowing in the loop, amperes.
LOOP SENSITIVITY
The loop sensitivity SL of an inductive-loop detector is defined as (2-17)
|
Loop sensitivity is equal to the change in loop system inductance induced by a conductive metal object divided by the original inductance of the loop system. |
where
LNV = Inductance in absence of vehicle, henrys
LV = Inductance with vehicle present, henrys.
The sensitivity SL for the air core transformer shown in Figure 2-10, assuming a quality factor Q greater than 10, is given by
 percent (2-18)
where
K = Coefficient of coupling
M21 = Mutual coupling between loop and shorted turn, henrys
L11 = Self inductance of loop, henrys
L22 = Self inductance of shorted turn, henrys.
Simplified expressions for the self inductance and mutual coupling can be derived by assuming the effect of vehicle iron is negligible. Then ![]() r =1 and the self inductance of the roadway loop of length l1 is found from Equation 2-6 as
r =1 and the self inductance of the roadway loop of length l1 is found from Equation 2-6 as (2-19)
The inductance of the shorted turn loop of length l2 is given by (2-20)
The mutual inductance between the shorted turn loop and the roadway loop is given by
 (2-21)
where
AV = Area of vehicle undercarriage, (meters)2
d21 = Distance between loop and shorted turn, meters.
The sensitivity is then expressed as
 (2-22)
where AV ![]() A.
A.
Equation 2-22 shows that the sensitivity decreases for loop areas larger than the vehicle undercarriage area. The sensitivity decreases as the square of the vehicle undercarriage distance from the loop. The sensitivity is independent of the number of loop turns; however, pulling the turns apart slightly increases sensitivity by increasing l1 at the expense of a deeper sawcut slot in the roadway.
Appendix E contains more complex formulas for calculating SL for two-turn and other multi-turn inductive loops. Comparisons of measured and calculated sensitivities are also available in this appendix.
Figure 2-11 illustrates the variation of loop sensitivity with vehicle undercarriage height for 6- x 2-ft (1.8- x 0.6-m), 6- x 4-ft (1.8- x 1.2-m), and 6- x 6-ft (1.8- x 1.8-m) three-turn inductive loops. The sensitivity of the 6- x 2-ft (1.8- x 0.6-m) loop is small because of its short length l1.
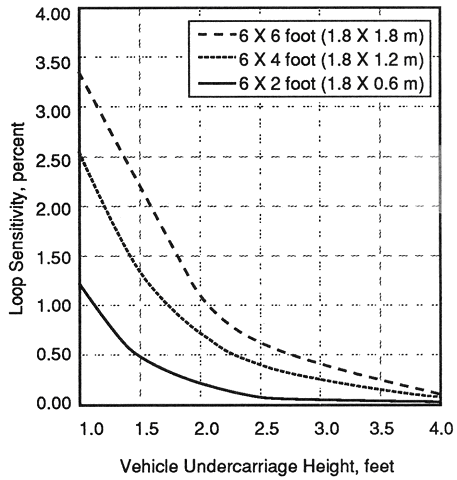
Figure 2-11. Calculated sensitivity of three-turn inductive loops as a function of vehicle undercarriage height.
Figure 2-12 depicts the decrease of loop sensitivity that occurs when a 200-ft (60-m) lead-in cable is added to the loops specified in Figure 2-11. The 6- x 2 ft (1.8- x 0.6-m) loop will probably double count a high-bed truck under this condition.
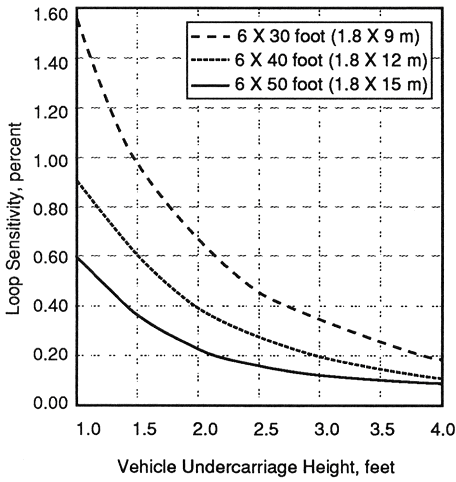
Figure 2-13 shows the decrease in loop sensitivity for a vehicle centered in two-turn long inductive loops as compared to the sensitivity of three-turn loops. Loop sensitivity decreases further when a lead-in cable is added.
EFFECT OF REINFORCING STEEL
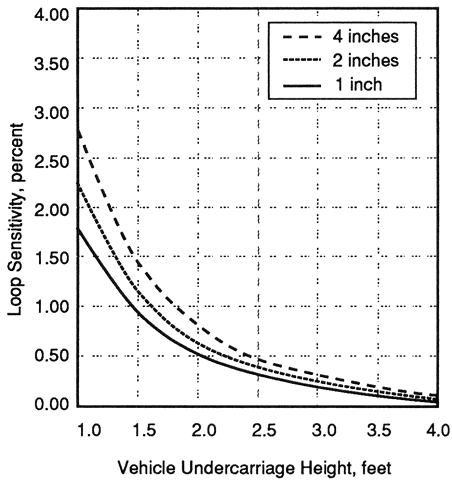
Figure 2-14 illustrates the reduction in loop sensitivity that occurs when an inductive-loop detector is installed over reinforcing steel mesh. The effect of the reinforcing steel is modeled as a shorted turn at twice the mesh spacing from the loop. The reinforcing steel reduces the magnetic field around the loop wire conductors, which causes a decrease in loop inductance and in loop sensitivity. Table 2-8 shows the effect on loop inductance when reinforcing steel is added to the pavement subsurface. The values are conservative since the mesh is assumed to be a perfect conductor. Modern inductive-loop detector electronic units are capable of detecting vehicles even though the loop wire is laid on the rebar before concrete is poured.
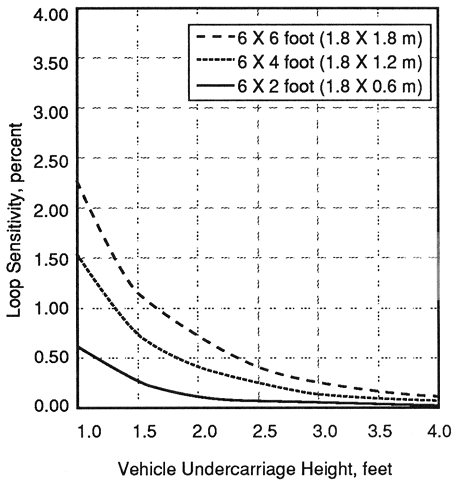
Figure 2-12. Calculated sensitivity of three-turn inductive loops with 200 ft (60 m) of lead-in cable as a function of vehicle undercarriage height.
1 ft = 0.3 m
Figure 2-13. Calculated sensitivity of two-turn long inductive loops as a function of vehicle undercarriage height.
1 ft = 0.3 m
Figure 2-14. Calculated sensitivity of 6- x 6-ft (1.8- x 1.8-m) inductive loop over reinforcing steel.
Inductive loops do not function as vehicle sensors when installed above steel rebar, whose pieces are connected such that current flows through the rebar. This induced current fully or partially cancels the vehicle-induced current in the inductive loop. If the rebar spacing is sufficiently large, then the current flows may not cancel. Conversely, if the rebar is not shorted together when it is installed, it will not support the flow of counter currents that inhibit the performance of the inductive loop.
| Number of turns | No reinforcing steel | Steel of 1-inch diameter | Steel of 2-inch diameter | Steel of 4-inch diameter |
|---|---|---|---|---|
| 1 | 11 | 9 | 10 | 10 |
| 2 | 35 | 28 | 31 | 33 |
| 3 | 73 | 56 | 63 | 68 |
| 4 | 121 | 89 | 103 | 112 |
| 5 | 179 | 127 | 151 | 166 |
| 6 | 248 | 167 | 206 | 228 |
| 7 | 325 | 206 | 266 | 298 |
|
1 inch = 2.5 cm |
||||
Epoxy coatings normally placed on rebar are insulating in nature. However, the nature of the coating process usually places voids in the coating, which allow currents to flow. The number of allowable voids may be specified in the construction documents. The counter-current flow may increase in winter months in cold climates where salts are placed on the roadway or bridge deck.
LOOP SYSTEM SENSITIVITY
Loop system sensitivity is defined as the smallest change of inductance at the electronics unit terminals that will cause the controller to actuate. This sensitivity must be equal to or greater than the threshold for the electronics unit. Many states specify that the electronics unit must respond to a 0.02 percent change in inductance. NEMA Standards (see Section 15.3.2 of Appendix J), recognizing the differences in electronics unit design (![]() L/L or
L/L or ![]() L), specify the sensitivity threshold for three classifications of test vehicles when they are centered in a single 6- x 6-ft (1.8- x 1.8-m) three-turn loop with 100 ft (30.5 m) of lead-in cable. The vehicle classes are:
L), specify the sensitivity threshold for three classifications of test vehicles when they are centered in a single 6- x 6-ft (1.8- x 1.8-m) three-turn loop with 100 ft (30.5 m) of lead-in cable. The vehicle classes are:
- Class 1: 0.13 percent (
 L/L) or 0.12
  H (
H ( L) inductance change (small motorcycle).
 - Class 2: 0.32 percent (
 L/L) or 0.3
  H (
H ( L) inductance change (large motorcycle).
 - Class 3: 3.2 percent (
 L/L) or 3.0
  H (
H ( L) inductance change (automobile).
An inductance in series or parallel with an inductive-loop detector will reduce the loop system sensitivity at the input terminals of the electronics unit.
A study performed for the SCANDI project in Detroit found that the duration of a call is impacted by the height of the flux field, which, in turn, depends on the presence and depth of reinforcing steel and other location-specific factors.(2) The study indicated that adjustable, diamond-shaped loops compensate for such factors at each location, resulting in a uniform duration from loop to loop for a given vehicle at a given speed.
SENSITIVITY OF TWO SERIES INDUCTORS
Figure 2-15 illustrates the total inductance calculation for the combination of two separate inductive loops connected in series as one equivalent loop. (Figure 2-19 illustrates the connection of two loops in this manner.) The equivalent total series inductance LTS is![]() (2-23)
(2-23)
where LA and LB are the individual inductance values of the loops.
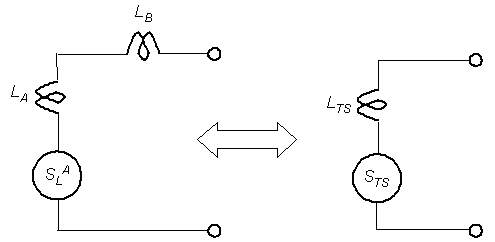
Figure 2-15. Equivalent total inductance from two inductive loops in series.
The equivalent total series sensitivity STS is (2-24)
where ![]() Loop sensitivity as vehicle enters Loop A.
Loop sensitivity as vehicle enters Loop A.
SENSITIVITY OF TWO PARALLEL INDUCTORS
Figure 2-16 illustrates the sensitivity calculation for two separate inductive loops connected in parallel as an equivalent single loop. (Figure 2-21 illustrates the connection of two loops in this manner.) The equivalent total parallel inductance LTP is (2-25)
The equivalent total parallel sensitivity STP is  (2-26)
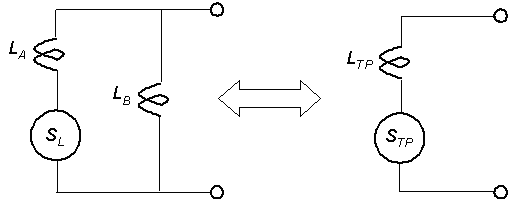
Figure 2-16. Equivalent total inductance from two inductive loops in parallel.
SINGLE LOOP EXAMPLE
1. What is the loop sensitivity at the pull box assuming a high-bed vehicle (4-ft (1.2-m) undercarriage) passes over the loop? Figure 2-17 illustrates this case and gives the lead-in wire lengths. The equivalent electrical circuit is shown in Figure 2-18.
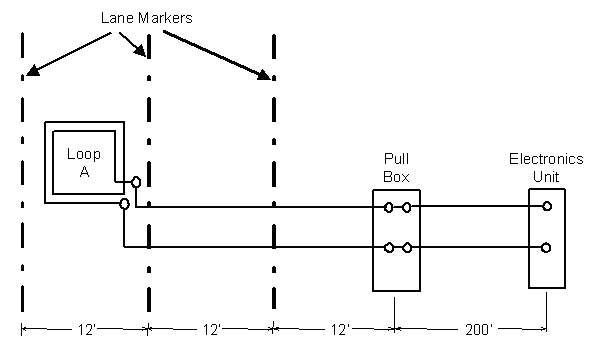
Figure 2-17. Single inductive loop connected to a pull box and electronics unit.

Figure 2-18. Equivalent single loop electrical circuit.
The sensitivity SL for a 4-ft (1.2-m) high undercarriage and a three-turn, 6- x 6-ft (1.8- x 1.8-m) loop of #14 AWG wire is 0.1 percent from Figure 2-11. The twisted loop wires form an approximately 24-ft (7.3-m) lead-in wire to the pull box. The inductance per foot for #14 AWG loop wire with 5 twists per foot is 0.22 ![]() H/ft (0.7
H/ft (0.7 ![]() H/m). The lead-in inductance LS is
H/m). The lead-in inductance LS is ![]() (2-27)
(2-27)
The self inductance LL of a three-turn, 1.8-1.8-m (6- x 6-ft) loop of #14 AWG wire at 20 kHz from Appendix C is 74 ![]() H. Therefore, the sensitivity SP (in percent) at the pull box is
H. Therefore, the sensitivity SP (in percent) at the pull box is  (2-28)
2. What is the inductive-loop system sensitivity at the input terminals of the electronics unit with a 200-ft (61-m) length of Type 8720 shielded lead-in cable between the pull box and the electronics unit?
From Table 2-6, the inductance of type 8720 cable is 0.22 ![]() H/ft. The total series inductance between the loop and the input terminals of the electronics unit is
H/ft. The total series inductance between the loop and the input terminals of the electronics unit is ![]() (2-29a)
(2-29a)![]() (2-29b)
(2-29b)
Then the sensitivity SD at the input terminals of the electronics unit is  (2-30)
3. What is the inductive-loop system sensitivity at the input terminals of the electronics unit with a 200-ft (61-m) length of Type 8720 shielded lead-in cable between the pull box and the electronics unit if a four-turn, 6- x 6-ft (1.8- x 1.8-m) loop #14 AWG wire is used?
The sensitivity SL for a 4-ft (1.2-m) high undercarriage and four-turn, 6- x 6-ft (1.8- x 1.8-m) loop is 0.1 percent. From Appendix C, the loop self inductance is 125 ![]() H at 20 kHz. The series inductance is the same as in the previous example.
H at 20 kHz. The series inductance is the same as in the previous example.
Therefore (2-31)
TWO LOOPS IN SERIES EXAMPLE
1. What is the inductive-loop system sensitivity at the input terminals of the electronics unit when a second identical loop is placed in series with the loop sensing the vehicle? Figure 2-19 illustrates the loop configuration and shows lead-in wire lengths. The series connection is made in the pull box.
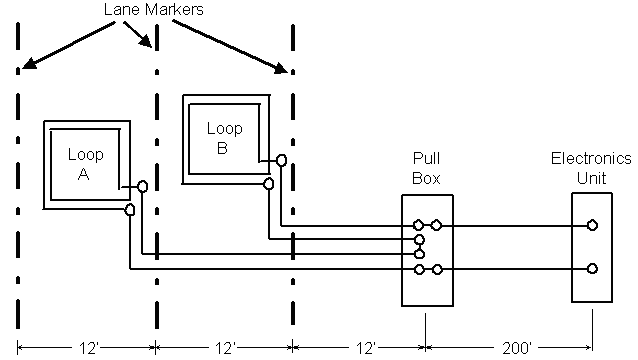
Figure 2-19. Two inductive loops connected in series to a pull box and electronics unit.
Figure 2-20 shows the equivalent electrical circuit. The sensing loop is a 6- x 6-ft (1.8- x 1.8-m), three-turn loop of #14 AWG wire. The self inductance of the second loop (i.e., series Loop B) is 74 ![]() H. The lead-in wire inductance for Loop B is
H. The lead-in wire inductance for Loop B is![]() (2-32)
(2-32)
The total series inductance of Loop B and lead-in wire to the pull box is ![]() (2-33)
(2-33)
and the total series inductance between the two loops and the input terminals of the electronics unit is![]() (2-34a)
(2-34a)![]() (2-34b)
(2-34b)
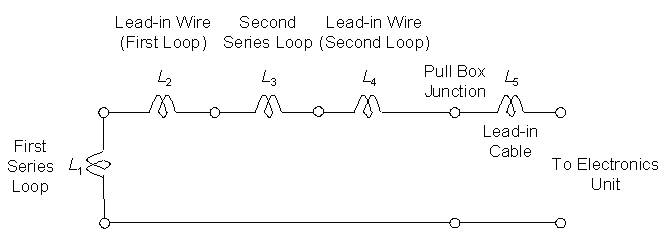
Figure 2-20. Equivalent electrical circuit for two loops connected in series to a pull box and electronics unit.
Then  (2-35)
TWO LOOPS IN PARALLEL EXAMPLE
1. What is the loop system sensitivity at the electronics unit terminals with two identical loops connected in parallel? Figure 2-21 illustrates the loop configuration and shows lead-in wire lengths. The equivalent electrical circuit is shown in Figure 2-22. All parameters are the same as in the previous series loop example. The total inductance and sensitivity at the input to the electronics unit are calculated as ![]() (2-36)
(2-36)
and (2-37)
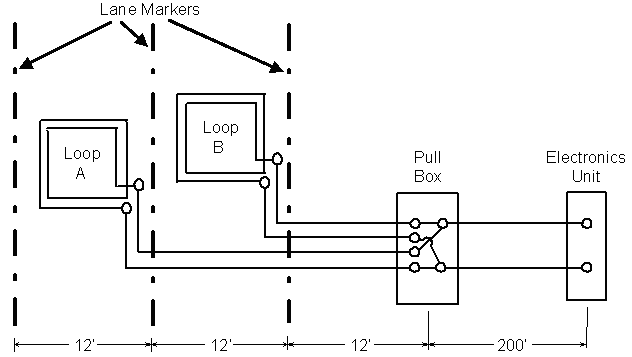
Figure 2-21. Two inductive loops connected in parallel to a pull box and electronics unit.
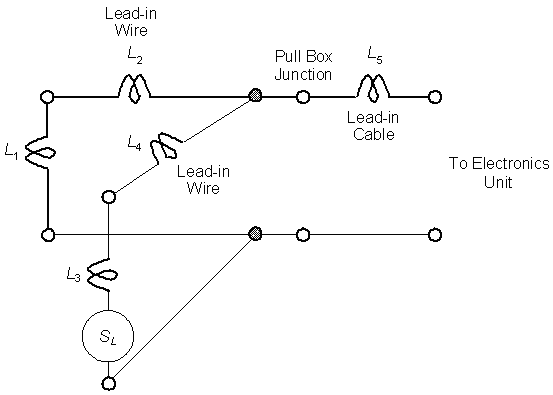
Figure 2-22. Equivalent electrical circuit for two loops connected in parallel to a pull box and electronics unit.
Let![]() (2-38)
(2-38)
and![]() (2-39)
(2-39)
Then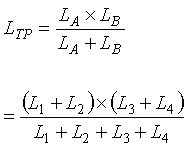 (2-40)
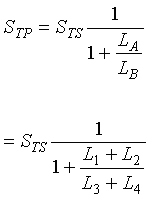 (2-41)
and (2-42)
 (2-43)
Therefore (2-44)
RESONANT CIRCUIT
Many self-tuning inductive-loop electronics units use a frequency shift or change in period of an oscillator to indicate the passage or presence of a vehicle. The frequency of the oscillator is controlled by a parallel resonant circuit, sometimes called a tank circuit, composed of the equivalent loop system inductance and the tuning capacitance found in the electronics unit. The equivalent loop system capacitance also includes capacitive effects due to the placement of the loop wires in the sawcut. The associated equivalent quality factor accounts for the effect of system resistance losses. If the equivalent loop system inductance is too small, the oscillator will not oscillate. The manufacturer of the electronics unit specifies the range of loop system inductance and minimum loop system quality factor that are acceptable.
The oscillator frequency is calculated as 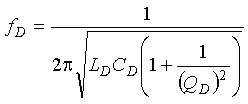 (2-45)
where LD, CD, QD are the inductance, capacitance, and quality factor, respectively, of the tank circuit.
Equation 2-45 shows that a decrease in the inductance increases the resonant frequency. Furthermore, a quality factor greater than five will have negligible effect on the performance of the resonant circuit.
TEMPORARY LOOPS
Several manufacturers and State agencies have sought to develop a durable and cost effective temporary loop that satisfies the needs of speed monitoring, vehicle counting, vehicle classification, and portable weigh-in-motion (WIM) programs. Two types of temporary and portable loop systems are described below.
MAT-TYPE LOOPS
The mat-type temporary loop consists of a durable rubber mat into which multiple turns of wire are embedded. The mats are usually smaller in width than the typical 6-ft (1.8-m) inductive loop. Standard sizes vary, ranging from 4 x 6 ft (1.2 x 1.8 m) to 3 x 6 ft (0.9 x 1.8 m). The mats are positioned in the center of the traffic lane with the longer dimension parallel to the flow of traffic so that most vehicles straddle the mat, thereby extending the life of the mat. A typical installation is shown in Figure 2-23. Nails and washers are commonly used to secure the mat to the road surface. A wide 3-inch (7.6-cm) heavy-duty adhesive tape is applied to prevent the mat edges from lifting. The lead-in wires from the mat to the data collection equipment at the roadside are encased between two layers of tape.
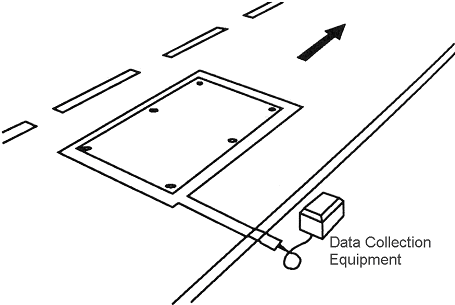
Figure 2-23. Typical installation of mat-type temporary inductive-loop detector.
Some agencies have manufactured this type of sensor in their own shop. However, hand-producing these mats was too labor intensive to be cost-effective. The mats were reliable, but with heavy truck traffic, some of the mats did not last more than a few hours.
OPEN LOOP CONFIGURATION
One manufacturer produces a preformed temporary portable loop that is 4 x 6 ft (1.2 x 1.8 m). The loop is composed of a sandwich of five layers as illustrated in Figure 2-24. The bottom layer is a 4-inch (101.6-mm) wide paper release sheet, which protects the 2-inch (50.8-mm) wide strip of adhesive bituminous rubber compound. Its upper surface is finished with a high-density polyethylene film. This padding strip is the bed for three turns of #22 AWG loop wire. An identical 2-inch (50.8-mm) padding strip covers the loop wires. The top layer is a 4-inch (101.6-mm) wide strip of adhesive bituminous compound reinforced with an overlay of woven polypropylene mesh.
The preformed, open loop configuration can be transported to the selected location and installed by one man in a few minutes. Installation consists of removing the bottom backing, positioning the loop on the roadway, and applying sufficient pressure to ensure adhesion. Five feet of protected lead-in wire is standard. Other loop dimensions and protected lead-in wire lengths are available.
Another approach to the open loop configuration was developed by the Special Study Section of the Nevada Department of Transportation (DOT).(3) The Nevada DOT previously used a 6- x 6-ft (1.8- x 1.8-m) portable loop constructed of three turns of #14 AWG stranded copper wire wrapped with black duct tape. Time consuming durability and maintenance issues increased as the use of the portable loops increased. This led to the testing of a variety of tapes, rubber tubing, and a rubber mat material as replacements for the duct tape covering of the original loops.
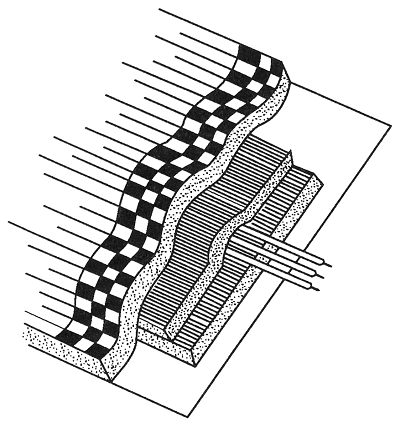
Figure 2-24. Five-layer temporary open loop detector configuration.
A bitumen tape manufactured by Polyguard Products was eventually selected to enclose the wire loops. It is a fabric-reinforced rubber-like material with one adhesive side. The final configuration consists of four turns of #14 AWG copper wire, wound in the shop, and taped together for easy handling. The loops are encased in two wraps of the Polyguard material and installed as shown in Figure 2-25.
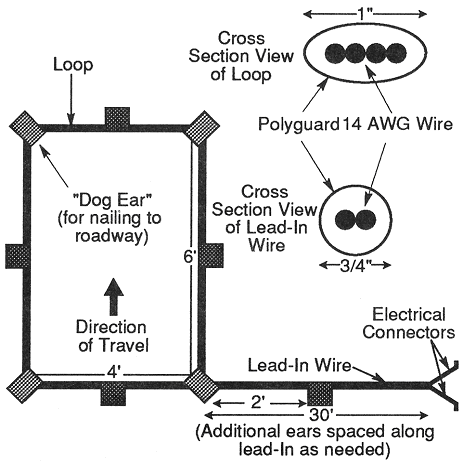
1 ft = 0.3 m
1 inch = 2.5 cm
Figure 2-25. Nevada portable open loop installation.
A number of tests were conducted to measure the durability and accuracy of the loops as compared with conventional loops installed in sawcut slots. Other tests compared the 4- x 6-ft (1.2- x 1.8-m) configuration to the 6- x 6-ft (1.8- x 1.8-m) configuration. The test loops were installed on a rural two-lane FAP roadway with a high percent of multiple unit trucks. Both series of tests used the same counter/classifier recorder.
After almost 5,000 actuations, there was less than 1 percent difference between the number of vehicles counted by this type of portable loop and a saw-cut installed loop. It was also found that the 4- x 6-ft (1.2- x 1.8-m) loop size performed virtually the same as the 6- x 6-ft (1.8- x 1.8-m) size whether the loop was in a saw-cut or in the portable form.
The portable loops were still functioning after a more than yearlong product durability test consisting of over a million activations. This evaluation, on U.S. 395 between Reno and Carson City, NV, showed the loops to be extremely durable and capable of withstanding a wide range of weather conditions. The roadway contained an asphalt surface and, after several months, the loops became embedded in the pavement, which may have contributed to their longevity. On a concrete surface, these loops are expected to last well past one-half million activations. The loops have also been used with overlays and were able to withstand the heat involved in this process.
Testing in a semipermanent location enhanced loop longevity, as the loops were not subjected to repeated removal and reinstallation. However, other loops of the same type have been repeatedly installed without signs of undue wear. As a result of these tests and the experience with these loops, the Nevada DOT is now using the Polyguard loop in all of their portable loop installations.
ELECTRONICS UNITS
The electronics unit, which generates the inductive-loop excitation frequency and monitors the operation of the inductive-loop system, has changed significantly since the 1970s. Early versions of inductive-loop electronic units operated at a fixed resonant frequency, using a crystal to stabilize the frequency. There were many problems with the crystal electronics units, particularly when used with long lead-in cables.
One of these was resonant-frequency drift due to environmental changes in temperature and moisture. These units were removed from service in the 1970s and were initially replaced with designs that incorporated analog phase shifters, which were capable of compensating for (or tracking) drift caused by environmental changes. Modern electronics units stabilize the oscillation frequency and detect vehicles with configurations that incorporate digital frequency shift, digital ratioed frequency shift, digital period shift, and digital ratioed period shift designs. The theory of operation of these devices is described below. Analog phase shift electronics units are still in limited use for vehicle classification.
ANALOG PHASE-SHIFT ELECTRONICS UNIT
This device was developed to meet the demands of the European market, where bicycles must be detected. Like the crystal model, it operates as a phase shift sensor, but uses two variable-frequency oscillators rather than one crystal-controlled oscillator. The loop oscillator operates at a frequency between 25 and 170 kHz, as determined by the loop and lead-in wire. The loop oscillator is coupled to a second internal oscillator such that the initial manual tuning procedure brings the two oscillators into synchronization in frequency and phase.
The tuning knob moves a ferrite core back and forth inside an inductor, causing the oscillator connected to it to change its frequency (and phase) to match that of the loop oscillator. Arrival of a vehicle into the loop decreases loop inductance and the loop oscillator attempts to pull out of synchronization with its companion oscillator. It is not able to change frequency because of a cross-coupling resistor, but a phase shift is developed that is the basis for vehicle detection.
With this design concept, the electronics unit is able to compensate for (or track) environmental drift. As the temperature within the controller cabinet changes, the two oscillators drift identically. The output of the two oscillators are fed to a phase comparison circuit, which develops a DC voltage proportional to the amount of shift; thus, the term analog because it uses varying voltages rather than digital counts to indicate vehicle passage or presence.
When there are no vehicles within the detection zone, the DC voltage is stored and remembered by a memory capacitor. When a vehicle causes a change in the phase comparator output, the difference between it and the memory capacitor causes a relay to change state. Very slow changes in the DC voltage are followed by the memory capacitor, which allows the circuit to compensate for drift due to environmental changes. The memory circuit will ultimately forget a vehicle parked over the loop and drop that call. Detail on compensating for environmental drift is included later under the "Digital Frequency Shift Electronics Unit."
OVERVIEW OF DIGITAL ELECTRONICS UNITS
The stability and added features afforded by electronic digital processing have lead most inductive-loop detector electronics unit manufacturers to produce digital devices. Digital techniques allow more reliable, accurate, and precise measurements than the analog techniques.
In using digital electronics units, one must be aware of the relation between increased sensitivity and the resulting increased response time. A large response time can result in a significant error in vehicle velocity measurements when two loops are utilized in a speed trap configuration (i.e., separated by a known and measured distance). Response times vary with electronics unit manufacturers.
Digital electronics units sense either a change in the frequency or period of a waveform. The oscillator frequency or period shift is caused by the decrease in loop inductance created when a vehicle is within the loop's detection zone. The oscillator frequency for a quality factor Q of 5 or greater is given by (2-46)
where
fD = Oscillator frequency, Hz
LD = Total inductance (i.e., loop plus lead-in cable) across the input terminals of the electronics unit, henrys
CD = Total capacitance across the input terminals of the electronics unit, henrys.
The normalized oscillator frequency change due to a normalized change in inductance at the input terminals to the electronics unit when the Q is 5 or greater is given by (2-47)
where
![]() fD = Change in oscillator frequency of the electronics unit, Hz
fD = Change in oscillator frequency of the electronics unit, Hz
![]() LD = Change in inductance at the input terminals of the electronics unit, henrys
LD = Change in inductance at the input terminals of the electronics unit, henrys
SD = Sensitivity of the electronics unit to the inductance change.
Vehicle detection by an inductive-loop detector system is primarily induced by vehicle proximity to a buried inductive wire loop, which causes a change in the loop inductance in the inductance-capacitance (LC) oscillator circuit formed by the loop, lead-in cable, and the input capacitor located in the electronics unit. Some manufacturers detect vehicles through the percent change of loop inductance ![]() LL/LL, while others simply use the change in loop inductance
LL/LL, while others simply use the change in loop inductance ![]() LL. Neither of these quantities can be measured directly at the input terminals to the electronics unit. However, to indicate sensitivity, several manufacturers provide frequency meters to measure the resonant frequency and the amount of frequency change.
LL. Neither of these quantities can be measured directly at the input terminals to the electronics unit. However, to indicate sensitivity, several manufacturers provide frequency meters to measure the resonant frequency and the amount of frequency change.
Experience shows that the percentage change of inductance (![]() LL/LL) from an unoccupied loop to an occupied loop is extremely repeatable for a given loop size and geometry, a given vehicle size and geometry, and a given location of the vehicle with respect to the loop. Since parameters such as actual loop inductance and loop operating frequency do not affect
LL/LL) from an unoccupied loop to an occupied loop is extremely repeatable for a given loop size and geometry, a given vehicle size and geometry, and a given location of the vehicle with respect to the loop. Since parameters such as actual loop inductance and loop operating frequency do not affect ![]() LL/LL but do affect
LL/LL but do affect ![]() LL, the following discussions and computations address the
LL, the following discussions and computations address the ![]() LL/LL concept. The term "electronics unit sensitivity," in the context of this discussion, is defined as the value of
LL/LL concept. The term "electronics unit sensitivity," in the context of this discussion, is defined as the value of ![]() LL/LL that actuates the electronics unit with smaller values, which are interpreted as denoting greater sensitivity.
LL/LL that actuates the electronics unit with smaller values, which are interpreted as denoting greater sensitivity.
For short lead-in cables with negligible series cable inductance (2-48)
where
![]() LL = Change in loop inductance when sensing a vehicle, henrys
LL = Change in loop inductance when sensing a vehicle, henrys
LL = Loop inductance, henrys
SL = Sensitivity of loop to vehicle in detection area.
The period of the oscillator TD is defined as the inverse of the frequency fD. For a Q of 5 or greater, TD is given by (2-49)
The normalized change in oscillator period caused by a normalized change in inductance at the input terminal to the electronics unit when Q is 5 or greater is approximately equal to (2-50)
The negative sign indicates that the change in period is opposite in direction to the change in inductance.
With the advent of sophisticated digital microprocessors and the availability of loop network resonant frequency information at the electronics unit input terminals, precise measurements of the following parameters can be obtained with relative ease:
- Frequency shift (
 fD).
fD). - Ratioed frequency shift (
 fD/fD).
 - Period shift (
 TD).
TD). - Ratioed period shift (
 TD/TD).
The four types of digital electronics units, each utilizing one of these measurement techniques, are introduced below. Detailed analyses and block diagrams of each device are provided in Appendices F through I.
DIGITAL FREQUENCY SHIFT ELECTRONICS UNIT
This type of unit is not manufactured. However, the theory and operating characteristics associated with this concept are included so that the operation of the digital ratioed frequency shift electronics unit may be better understood.
The digital processor in a digital shift electronics unit would compare counts proportional to the oscillator frequency when a vehicle is present to a reference count taken periodically when no vehicles are present. The reference count is stored in a memory. During vehicle detection, when the count exceeds the reference count by a preset sensitivity threshold count, a vehicle call is initiated.
The sensitivity ![]() of a frequency shift electronics unit is calculated from Equation 2-47 as
of a frequency shift electronics unit is calculated from Equation 2-47 as  (2-51)
Appendix F shows that  (2-52)
where
Nft = Fixed frequency threshold count selected by sensitivity switch
Nfc = Number of oscillator cycles counted by the variable frequency counter
Kf = Frequency sensitivity constant.
In the digital frequency shift method, SD is proportional to the square root of the LDCD product. Since larger values of SD represent decreased sensitivity, it follows that sensitivity decreases in proportion to the square root of the LDCD product with a ![]() fD measurement. Hence, every time the frequency switch is changed to a new position (e.g., to avoid crosstalk), the sensitivity would change and, if critical, would necessitate a new setting of the sensitivity switch.
fD measurement. Hence, every time the frequency switch is changed to a new position (e.g., to avoid crosstalk), the sensitivity would change and, if critical, would necessitate a new setting of the sensitivity switch.
Increased lead-in cable length increases the inductance of the lead-in cable and, hence, causes some loss of sensitivity. The increased LDCD product would cause even more loss of sensitivity. Therefore, this type of measurement does not appear to be practical.
DIGITAL RATIOED FREQUENCY SHIFT ELECTRONICS UNIT
The digital processor in the digital ratioed frequency shift electronics unit compares counts proportional to the oscillator frequency when a vehicle is present to a reference count taken periodically when no vehicle is present. The reference count is stored in memory. When the count during vehicle detection exceeds the reference count by a preset sensitivity threshold count, a vehicle call is initiated.
The ratioed frequency shift electronics unit differs from the frequency shift unit in that the frequency counter is held approximately constant (as explained further in Appendix G).
The sensitivity ![]() is independent of the inductance LD and the capacitance CD across the terminals of the electronics unit. The sensitivity is calculated as
is independent of the inductance LD and the capacitance CD across the terminals of the electronics unit. The sensitivity is calculated as (2-53)
where
Nft = Fixed frequency threshold count
Nfc = Count produced by the fixed frequency counter.
From Appendix G, the measurement response time tf is
 (2-54)
where m is a frequency multiplier.
The advantage of having the sensitivity independent of the inductance and capacitance across the input terminals of the electronics unit is illustrated by the following example. This example also applies to the digital ratioed period shift electronics unit discussed later.
Assume four equal size loops, say 6 x 6 ft (1.8 x 1.8 m) with an equal number of turns, say three. Connect the loops as shown in Figure 2-8, namely
- All series (296
 H).
H). - Series-parallel (74
 H).
H). - All parallel (18.5
 H).
H).
For simplicity, lead-in cable length is not considered. The sensitivity of the ratioed frequency or ratioed period shift electronics unit is identical for the above three loop connection configurations. Accordingly, a sensitivity threshold sufficient to detect a small motorcycle over one of the four loops when wired in series need not be changed when rewired in series-parallel or all parallel.
Although lead-in cable length was not considered above, an extra long lead-in cable will produce varying amounts of change in inductance due to inductance sharing. The amount of change depends on the length of the lead-in cable and the wiring scheme used for the multiple loops. Figure 2-26 provides an estimate of the inductance change at the electronics unit input terminals generated by a small motorcycle traveling over one of the four loops.(1)
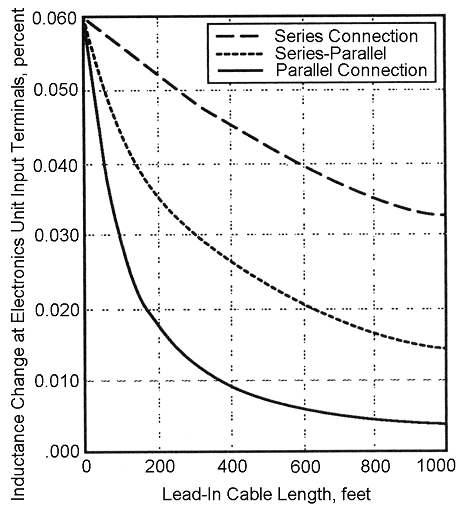
1 ft = 0.3 m
Figure 2-26. Inductance change produced by a small motorcycle as a function of lead-in cable length for series, parallel, and series-parallel connections of four 6- x 6-ft loops.
DIGITAL PERIOD SHIFT ELECTRONICS UNIT
The digital period shift concept utilizes the period of the loop oscillator frequency, where period is defined as the time required for one full cycle of the oscillator frequency. The period is calculated by dividing one by the frequency in Hz or equivalently dividing one by the frequency in cycles per second.
Digital period shift electronics units use a reference clock running at megahertz (MHz) frequencies, i.e., between 20 and 100 times faster than the inductive-loop oscillation frequency, to measure the period of the loop oscillation as shown in Figure 2-27. Measurement precision is enhanced without sacrificing a great deal of time between measurements by determining the time for 32 oscillation cycles for sensitivity one, 64 cycles for sensitivity two, and so on. The loop oscillation period is calculated in terms of the number n of reference clock cycles contained within the period. Since the oscillation frequency increases when a vehicle passes over the loop, the period of the oscillation decreases, as it is equal to the inverse of the frequency. The reduction in the oscillation period results in a smaller number of cycles of the reference clock within the oscillation period. When the number of reference cycles is reduced more than a preselected threshold, a call is initiated to indicate the presence of a vehicle.
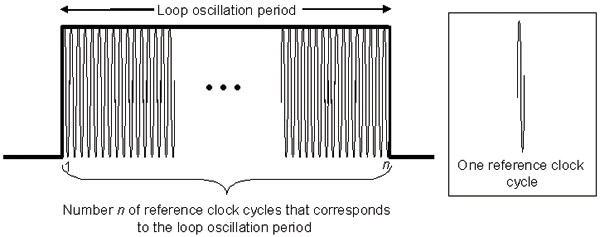
Figure 2-27. Measurement of inductive-loop oscillation period by a reference clock
(Source: L.A. Klein, Sensor Technologies and Data Requirements for ITS (Artech House, Norwood, MA, 2001)).
A judicious choice of reference clock frequency and threshold value (4 counts ± 2 counts) makes the digital period shift design practical at any frequency encountered in practice. The time to detect is sufficiently short to enable the electronics to sequentially scan or operate four small loops, one at a time, several times a second. (Multichannel operation is discussed later.)
The period shift electronics unit is entirely self-tuning on installation and, similar to most other designs, is able to track environmental drift. Like the digital frequency shift unit, most models stop tracking for a time after a vehicle enters the loop, to guarantee that the call placed by a small vehicle is held long enough to bring the green to that approach.
The sensitivity ![]() of a period shift electronics unit is found from Equation 2-50 as
of a period shift electronics unit is found from Equation 2-50 as  (2-55)
Appendix H shows that (2-56)
where
Npt = Fixed frequency threshold count selected by the sensitivity switch
Npc = Count produced by the variable frequency counter
Kp = Frequency sensitivity constant.
Sensitivity ![]() is inversely proportional to the square root of the LC product with a
is inversely proportional to the square root of the LC product with a ![]() T measurement. When
T measurement. When ![]() takes on small values, the sensitivity is increased. Hence, with increased lead-in cable length, part of the loss of sensitivity due to the added lead-in cable inductance is automatically compensated for by the increase in the LC product. Unfortunately, the compensation is not perfect because of the square root relationship.
takes on small values, the sensitivity is increased. Hence, with increased lead-in cable length, part of the loss of sensitivity due to the added lead-in cable inductance is automatically compensated for by the increase in the LC product. Unfortunately, the compensation is not perfect because of the square root relationship.
The response time tp of the electronics unit, as derived in Appendix H, is  (2-57)
Most electronics units use a transformer to connect the external inductive-loop terminals to the internal oscillator. A loosely coupled transformer produces a series leakage or swamping inductance. This inductance reduces the influence of the lead-in cable on sensitivity at the expense of overall sensitivity.
If a swamping inductance LT is used in the electronics unit, then 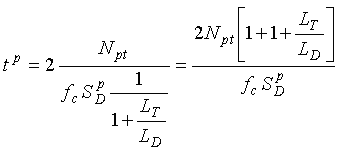 (2-58)
For example, let
Npt = 4
LT = 150 ![]() H
H
LD = 75 ![]() H
H
fD = 2.22 MHz
![]() = 0.005%.
= 0.005%.
Then  (2-59)
The percentage error in vehicle speed obtained from a speed trap using two inductive loops a known distance apart is given by  (2-60)
where
![]() S/S = Error in vehicle speed, percent
S/S = Error in vehicle speed, percent
![]() T = Error in measured time, seconds
T = Error in measured time, seconds
X = Distance between leading edges of the loop, distance units
S = Vehicle speed, distance units/second.
The maximum measured time error in vehicle speed or occupancy measurements is attributed to the response time of the electronics unit. The speed measurement error caused by finite response times is illustrated by the following example.
Let
![]() S/S = Unknown error in vehicle speed, percent
S/S = Unknown error in vehicle speed, percent
![]() T = 2 x 216 milliseconds (ms) = 432 ms (0.432-second error in measured time)
T = 2 x 216 milliseconds (ms) = 432 ms (0.432-second error in measured time)
X = 100-ft (30.5-m) spacing between leading edges of the loop
S = 60 miles per hour (mi/h) = 88 ft/s (96.6 kilometers per hour (km/hr) = 2.68 m/s) vehicle speed.
Then (2-61)
This example indicates that the loop system should be designed so that the system sensitivity is as large as possible. By setting the electronics unit to a less sensitive range, the response time is decreased, producing a more accurate vehicle speed measurement.
An increase in the electronics unit's clock frequency from 2.22 MHz to 22.2 MHz reduces the percentage velocity error from 38 percent to 3.8 percent. Many of the newer electronics units use clock frequencies between 20 and 25 MHz and, thus, are capable of reducing the percent velocity error.
DIGITAL RATIOED PERIOD SHIFT ELECTRONICS UNIT
The digital processor in this design compares counts proportional to the oscillator period when a vehicle is present to a reference count taken periodically when no vehicle is present. The reference count is stored in memory. When the count during detection is less than the reference count by a preset sensitivity threshold count, a vehicle call is initiated. The ratioed period shift electronics unit differs from the period shift electronics unit in that the threshold count Npt is not fixed.
The threshold count (see Appendix I) is given by
 (2-62)
Since the sensitivity of the electronics unit is independent of the count measured by the period counter, the sensitivity is also independent of frequency. The response time is identical to that of the digital period shift electronics unit.
COMPARISON OF DIGITAL ELECTRONICS UNITS
Table 2-9 compares the various inductive-loop digital electronics unit concepts in terms of sensitivity and response time.
| Digital electronics unit type | Sensitivity (SD) | Response time | Interpretation |
|---|---|---|---|
| Frequency shift | tf = frame time | Sensitivity decreases when the inductance increases from the use of a larger loop or longer lead-in cable. Response time is fixed by the frame time of the electronics unit. | |
| Ratioed frequency shift |  |
 |
Sensitivity is independent of the inductance value at the input terminals to the electronics unit. Response time increases directly with an increase in inductance at the input terminals to the electronics unit and inversely with sensitivity of the unit. |
| Period shift |  |
 |
Sensitivity is increased by increase in size of loop and longer lead-in cable. However, the effect of a change in inductance is mitigated by a swamping inductance from a loosely coupled transformer. Response time is dependent on loop inductance. |
| Ratioed period shift |  |
Sensitivity is independent of inductance value at the input terminals to the electronics unit. Response time is dependent on loop inductance. |
MULTICHANNEL DIGITAL MODELS
Controller cabinet space can be conserved if the electronics unit can operate more than one loop. Most digital electronics unit manufacturers offer products that can operate four or more loops. Some models address the crosstalk problem by providing a frequency-separation switch, while others separate the loops by a time-division scanning process.
One manufacturer's scanning electronics unit energizes and analyzes each of four or more channels sequentially up to 100 times per second. The digital period shift electronics unit is inherently fast enough to permit scanning. The time to analyze a channel depends on the sensitivity desired, as high precision in thresholding demands more time for counting reference pulses.
For example, if three 150 ![]() H loops were connected and used with sensitivities of 1, 4, and 6, and the fourth channel was switched to off, then the four channels would require 2.3, 9, 63, and 0.9 ms respectively, for a total of 75 ms. Each channel would be energized and analyzed 1,000 ÷ 75 = 13 times per second. The use of loops with larger inductance values reduces the scan rate, as does the selection of the highest sensitivity settings on the unit. If more than four similar and nearby loops are involved, the frequency switch or the size and/or number of turns in the loops can be varied to provide crosstalk protection. Equation 2-40 and Tables 2-2, 2-3, and 2-4 can be used to design frequency separations of 7 percent or more.
H loops were connected and used with sensitivities of 1, 4, and 6, and the fourth channel was switched to off, then the four channels would require 2.3, 9, 63, and 0.9 ms respectively, for a total of 75 ms. Each channel would be energized and analyzed 1,000 ÷ 75 = 13 times per second. The use of loops with larger inductance values reduces the scan rate, as does the selection of the highest sensitivity settings on the unit. If more than four similar and nearby loops are involved, the frequency switch or the size and/or number of turns in the loops can be varied to provide crosstalk protection. Equation 2-40 and Tables 2-2, 2-3, and 2-4 can be used to design frequency separations of 7 percent or more.
Manufacturers utilize higher clock speeds to provide faster scanning rates. For example, on the lower sensitivity settings, the sample time is 0.5 ms per channel. Therefore, the total time to scan all four channels is 2 ms. When a channel is switched off, the scan time for that channel is zero.
ADDED FEATURES FOR DIGITAL ELECTRONICS UNITS
During the l980s, several refinements were incorporated into inductive-loop detector digital electronics units. Recognizing the heavy demand on maintenance dollars, some manufacturers added circuitry that reduces the frequency of trouble calls to reset units attached to faulty loops. These features, intended to reduce maintenance costs and maximize traffic performance, include open loop test, automatic reset, and remote reset, as discussed below.
Open Loop Test
This feature allows the electronics unit to continue to operate an intermittently open loop system. A momentary open caused by a broken wire, poor splice, or loose connection will be stored in memory. If the connection remakes, the unit will promptly retune and continue to operate properly. If the open continues, it will result in a constant call.
When making a service call to the intersection, the technician may observe an indicator light that will flash a distinct pattern if an open has occurred. With other brands of electronics units, the technician presses the "Open Loop Test" button to determine whether an opening has occurred since the last service call. The open loop memory can be queried repeatedly as it can be reset only by power interruptions (such as removing the module from its card rack and reinserting) or by pressing the common reset button on the electronics unit. This constitutes a system reset, which will clear the open loop memory.
Automatic Reset
Some electronics units can be programmed to generate an internal reset if a call (i.e., the output of the electronics unit) exceeds the programmed time. The reset is controlled by the termination of the associated phase green. One agency claims that this feature reduced their electronics unit maintenance costs by 42 percent.
Remote Reset
Remote reset allows automatic investigation of suspicious calls generated by computer or software-program control systems. A remote master monitoring the actuations of each system sensor may suspect that an electronics unit is malfunctioning. By asserting the Reset command, the unit can frequently be returned to normal operation. The reset causes presence calls to be cleared, but it does not clear open loop memory nor does it prevent an open loop from calling.
If the reset fails to restore normal operation, the fault can be recognized and printed out for maintenance attention. An open loop that is constantly calling can be taken off line so that it does not falsely influence system operating parameters.
INDEPENDENT LOOP FAIL OUTPUT
In addition to the normal output of the electronics unit, a second output for loop status is provided on some models. Whenever the loop inductance undergoes a step change of ± 25 percent or more, the loop fail output is turned on. If the inductance returns to a value less than ± 25 percent of the reference, the loop fail output turns off. This enables remote interrogation of the loop status.
Other fault detection algorithms are embedded in the microprocessors found in modern controllers. These algorithms output digital codes that identify the fault type to a controller, which transmits the information to a central location.
VEHICLE CLASSIFICATION
Newer inductive-loop detector electronics units and loop configurations are capable of vehicle classification. The electronics module shown in Figure 2-28 uses artificial neural network software to classify the traffic stream into the 23 categories depicted in Figure 2-29. The first 13 are the standard FHWA classes, while the remaining ones represent vehicles with unique characteristics.(4)
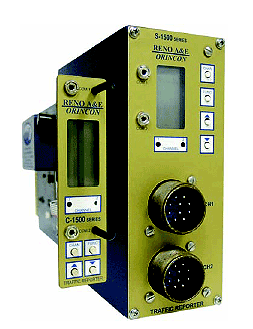
Figure 2-28. Model S-1500 inductive-loop vehicle classifier and speed sensor (Photograph courtesy of Reno A&E, Reno, NV).
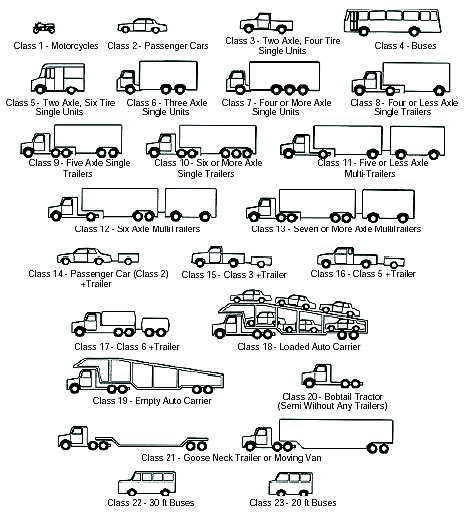
Figure 2-29. Classes available from inductive-loop classifying sensor
(Source: Model IVS-2000 Installation and Operation Manual, Rev. 1.53 (Intersection Development Corp, Downey, CA, Sept. 1997)).
Special configurations of inductive loops have been developed to detect axles and their relative position in a vehicle. Such systems are used at toll plazas to elicit the correct payment for the vehicle class. In the application shown in Figure 2-30, an axle loop array is situated between two main loops. Axle presence is detected by the axle loop array. The relative position of the axles in the vehicle is determined from the signatures provided by the main loops. The data obtained are vehicle length, speed, acceleration, vehicle type, number of axles, and axle separation. Profile information can also be obtained to refine and validate classification in ambiguous cases. This electronics unit, as well as the one shown in Figure 2-28, can be used to identify transit buses and provide priority treatment at traffic signals.
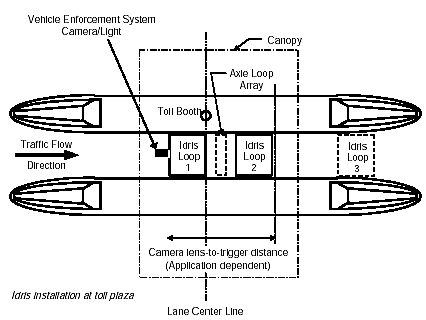
Figure 2-30. Axle location and vehicle classification using an array of inductive loops
(Drawing courtesy of Peek Traffic, Inc.—Sarasota, Sarasota, FL).
FHWA-HRT-06-108
